

Every time a leadership team approves a culture budget, someone in the room is doing mental math they don't say out loud. Is this real, or are we just spending money to feel good about spending money?
That tension used to be hard to resolve.
The answer used to be: we think it's working, but we can't quite show you the numbers. That doesn't hold anymore.
The measurement tools available now are genuinely different from those that existed five years ago, and the organizations that use them well are having completely different conversations with their finance teams.
What follows in this article is a practical account of how that actually works, the metrics, the infrastructure, the honest accounting of where it gets complicated, and what to do in those spots.
Understanding ROI in Team-Building and Culture
ROI in this context means the same thing it means anywhere: what did you get back relative to what you put in? But culture makes the math harder in a few specific ways that are worth naming directly.
The first complication is that the outcomes culture shapes are often shared with ten other variables.
A team ships faster. Is that the cross-functional alignment workshop from Q2, the new PM, the reduction in approval layers, or the fact that the product is more mature?
Probably all of it. That doesn't make measurement impossible, but it makes attribution a design problem rather than a dead end.
The second complication is timing.
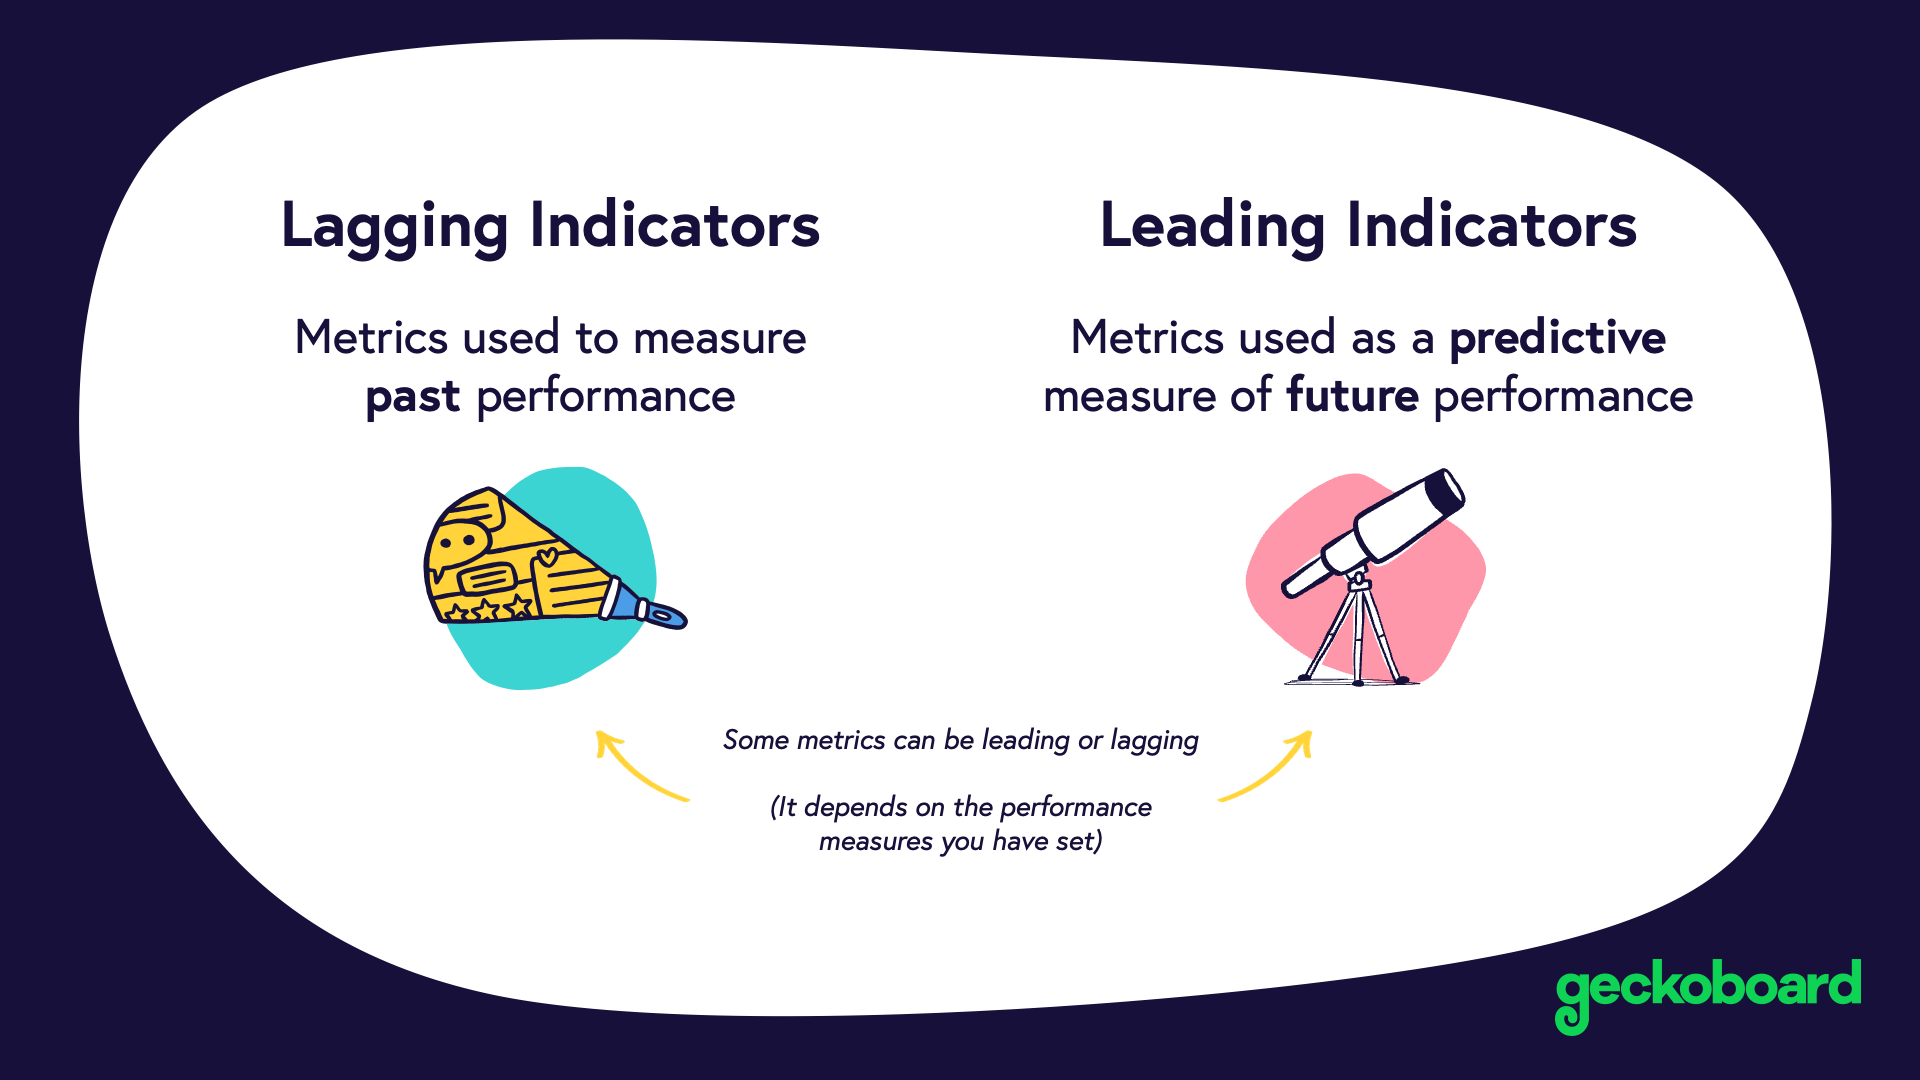
Retention doesn't move in the same quarter you improve manager effectiveness. Trust doesn't rebuild in a month. So if you only look at lagging indicators, the outcomes you ultimately care about, you'll lose the thread between cause and effect entirely.
Leading indicators solve this, and they're more useful than most people realize.
The third complication is the one nobody says at budget meetings: some leaders genuinely don't believe sentiment data is real data.
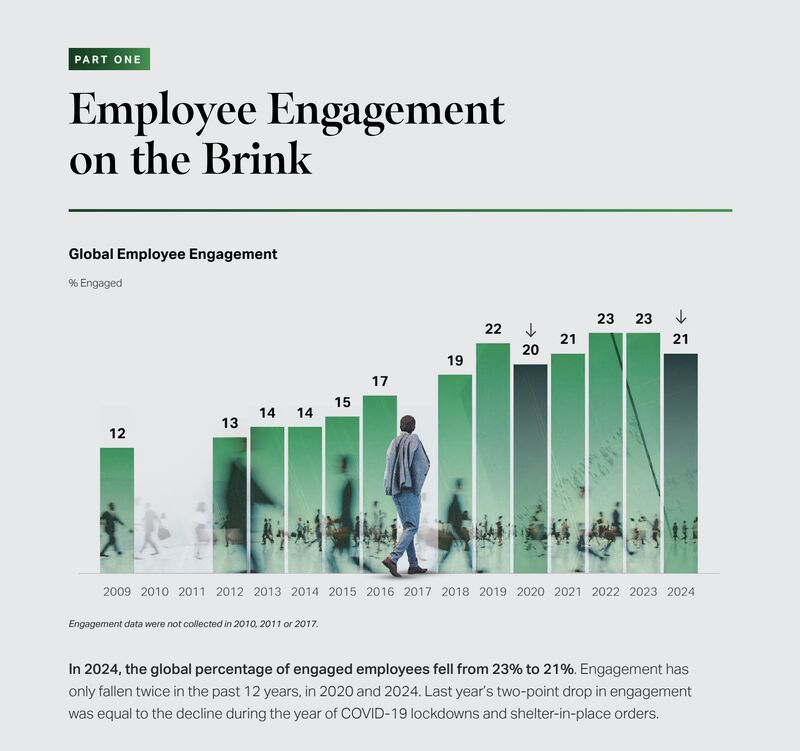
Gallup's research on team engagement is about as robust as organizational data gets, and it shows consistently that highly engaged teams outperform on both profitability and retention. This isn't a soft argument anymore.
But you'll still encounter people who dismiss pulse survey scores as noise. The answer is to show that sentiment shifts preceded outcome shifts by three months, repeatedly, in your own data. That's harder to wave away.
What ROI measurement does, at its core, is replace advocacy with evidence. You stop saying culture matters and start showing how it moved.
Identifying Key Metrics That Matter
Most organizations that start a culture measurement program pick twelve metrics, get overwhelmed, produce a dashboard nobody reads, and quietly stop.
The way it actually works is you pick one business problem and reverse-engineer it.
Say the problem is regretted attrition, you're losing people you didn't want to lose, and it's costing you recruiting time, institutional knowledge, and momentum.
The lagging metric is obvious: regretted attrition rate, combined with a genuine cost-per-departure calculation that includes replacement costs, lost productivity during ramp, and the subtler drag of team disruption.
If you're replacing someone at a mid-senior level, the real cost is often 1.5 to 2x their annual salary once you add it all up.
Now you need the leading indicators, the things that move three to six months before people leave:
- Manager effectiveness scores
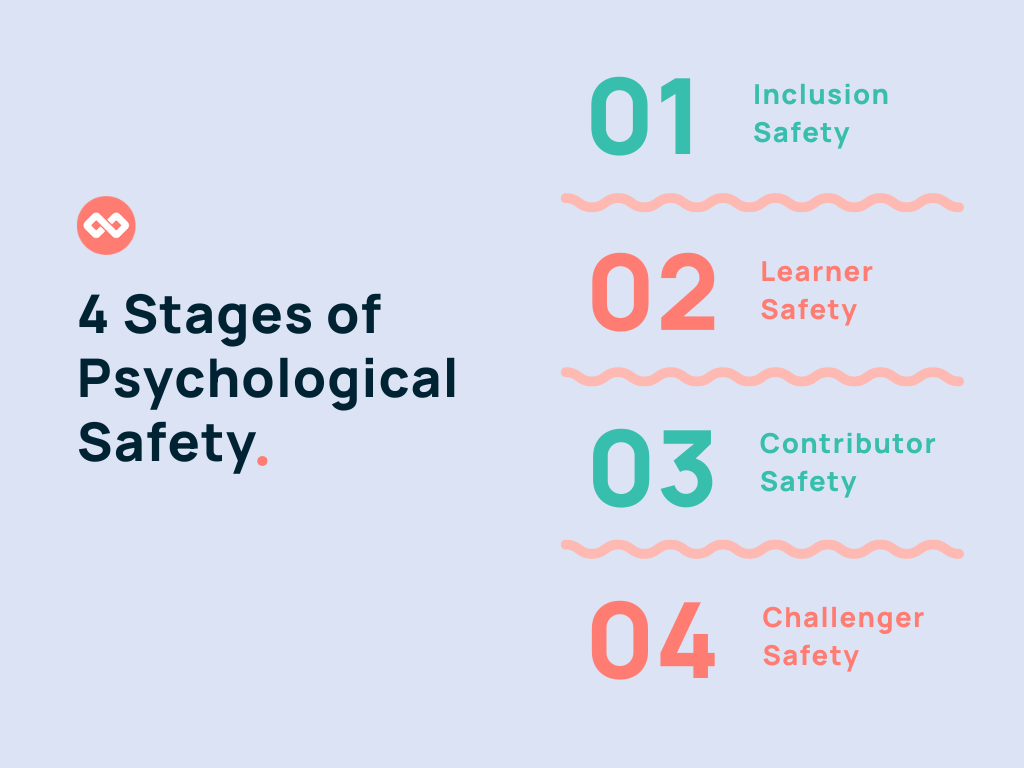
- Belonging and psychological safety
- Workload balance
These are your early warning system, and they're also where your interventions go. You don't fix attrition by doing an attrition intervention. You fix it by improving the things that make people want to stay.
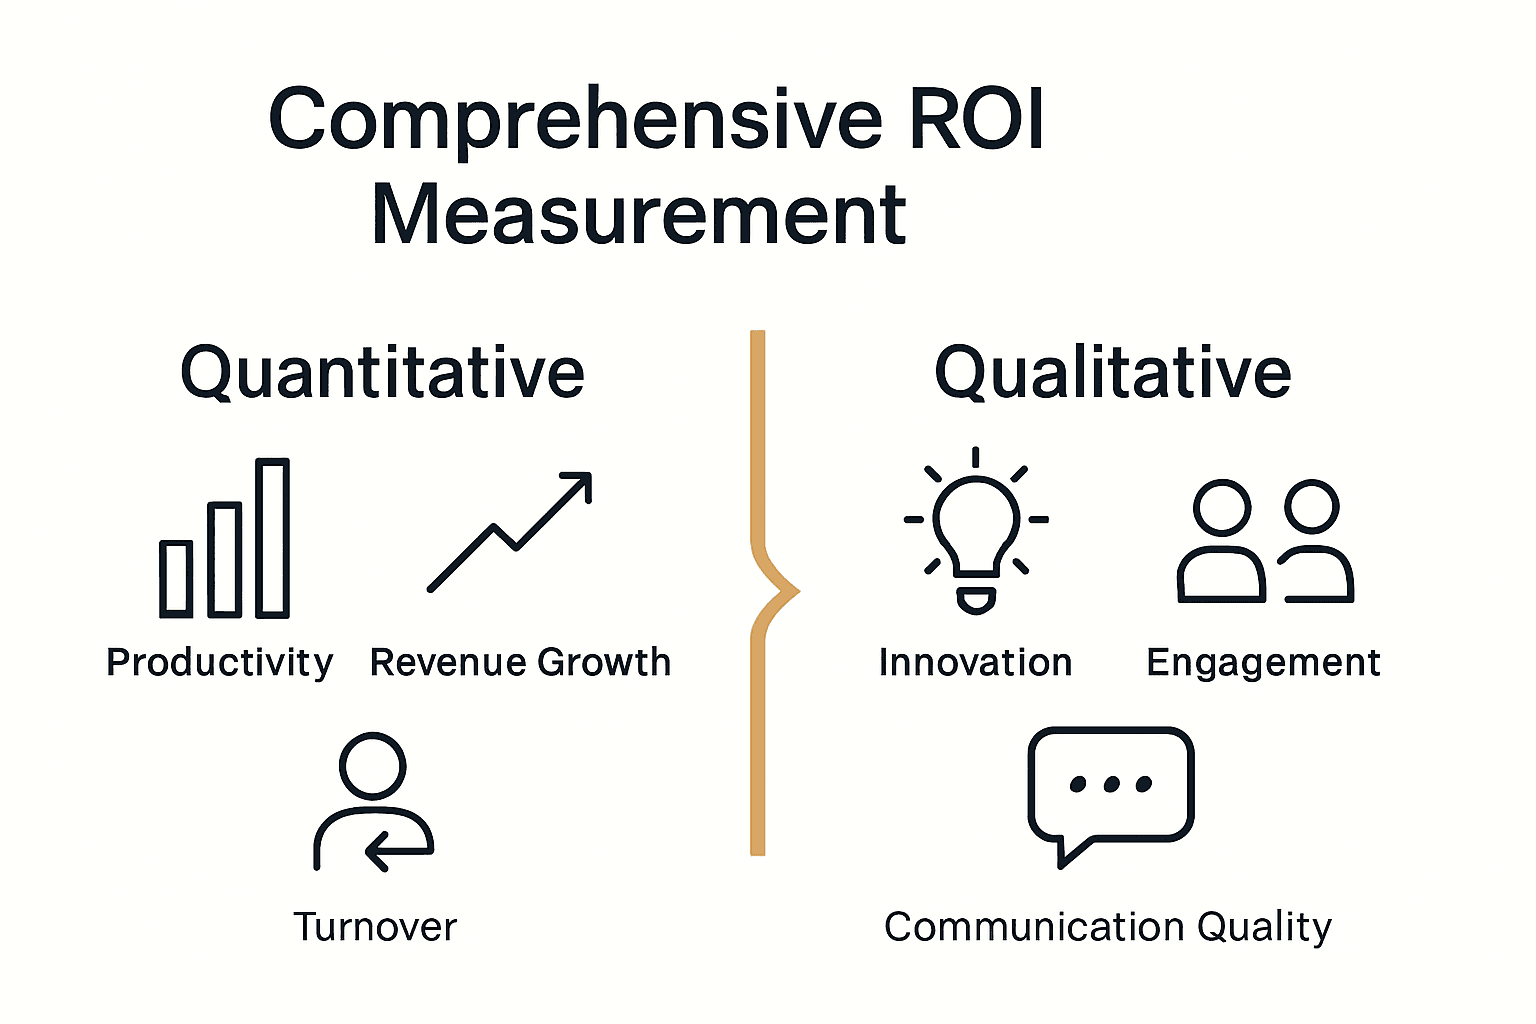
On the quantitative side, the metrics worth tracking:
- Retention rate and, separately, regretted attrition: Not every departure is a loss, and conflating them muddies the signal
- Cycle time and time-to-market for product teams: Culture shows up in delivery speed faster than almost anywhere else
- Throughput and quality: Defect rates, rework volume, the ratio of time spent building versus fixing
- Customer outcomes: NPS and CSAT are downstream of whether teams are working well together
- Internal mobility rate: Signals whether people see a future inside the organization or only outside it
The linkage that matters: each metric on your list should trace back to a specific business outcome.
If you can't draw that line, drop the metric.
Tools and Technologies for Measurement
The honest thing to say about the 2026 measurement stack is that it's genuinely good, and most organizations are using maybe 40% of it well.
Employee feedback platforms
The shift from annual engagement surveys to always-on pulse systems changed what you can actually see
You can catch a sentiment shift in a specific team or region within weeks, not at the end of the fiscal year when it's too late to do anything.
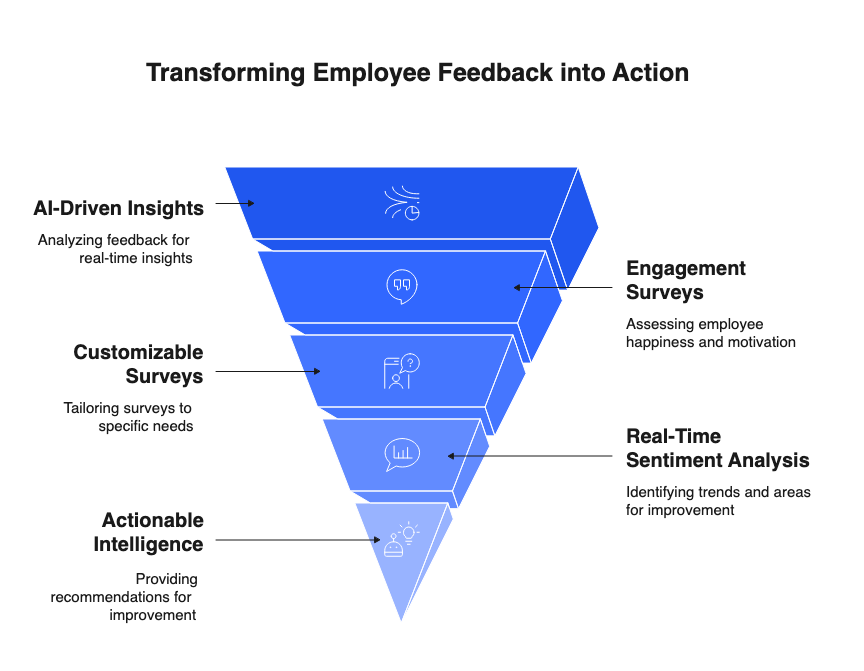
The good platforms now do automatic theme extraction from open-text responses, which means you don't need to manually read ten thousand comment fields.
People analytics and HRIS integration
Headcount, turnover, compensation, internal mobility, learning completion, and performance data can reveal patterns that you'd never see otherwise.
ISO 30414, the human capital reporting standard, has pushed more consistency here, which matters for benchmarking.
Collaboration analytics
These tools analyze calendar data, messaging metadata, and project structures to show you network cohesion, who talks to whom, how information actually moves, and where collaboration bottlenecks sit.
Microsoft's Work Trend Index research has documented how collaboration patterns shape focus time and productivity in ways that aren't obvious from looking at output data alone.
A team that seems to be performing fine might be doing so despite a structural isolation problem that's burning them out.
Delivery metrics
DORA metrics in particular are the closest thing engineering and product teams have to a real-time culture readout.
Deployment frequency, change failure rate, time to restore service: these aren't just technical metrics. They're reflections of how well a team communicates, resolves conflict, and trusts each other to catch mistakes.
AI-assisted analysis
Sentiment analysis, anomaly detection in engagement trends, and early-warning clustering can surface something unusual in a team's communication patterns before a manager has noticed anything wrong.
One thing that needs saying: use all of this responsibly. If employees don't believe their data is being used to help them rather than surveil them, participation rates drop, and your measurement system degrades.
Implementing an ROI Measurement Strategy
Here's the sequence that actually works.
Team-building investments often range from leadership workshops and recognition programs to company events, branded merchandise, and custom t-shirts.
Step 1: Start with a business question, not a culture question
"How do we improve our culture?" is not a useful starting point for measurement.
"Why did we lose eight engineers in Q3, and what do we need to change to stop that pattern?" is. The business question determines everything downstream, which metrics matter, which interventions to test, and how you'll know if it worked.
Vladyslav Sokol, CEO of Academy Smart, runs a software development company that helps organizations align technology investments with measurable business outcomes.
He notes, "The organizations that see the strongest results from culture initiatives are usually the ones that start with an operational problem, not a culture objective. When measurement is tied directly to retention, delivery speed, or collaboration outcomes, it becomes much easier to identify what is working and justify continued investment."
Step 2: Map the levers
Once you have the business question, map backward to the cultural variables that influence the outcome.
For delivery speed: cross-team collaboration, decision clarity, and meeting quality. For retention: manager effectiveness, belonging, and workload sustainability.
This mapping should be explicit, written down, and agreed on, because it's what you'll use to defend your logic when someone questions whether the intervention caused the change.
Step 3: Build a balanced metric set
Find two to three lagging metrics and leading indicators, so the baselines are captured before any intervention begins.
This last part is where most efforts fail, people launch the program, then try to construct a baseline retroactively from incomplete data. Capture at least one to two months of clean baseline data first.
Step 4: Design a testable intervention, not a culture overhaul
The instinct when you've identified a problem is to fix everything at once. Resist it.
Pick one or two targeted changes and run them with a pilot group. Leave a comparable control group unchanged. This gives you the comparison you need to make attribution credible.
Step 5: Run the cadence
Look at monthly pulse surveys and quarterly deep reviews.
The monthly data is your early warning system and your intervention signal. The quarterly reviews are where you look at whether lagging indicators are starting to move and whether your leading indicator thesis is holding.
Step 6: Calculate ROI honestly
Estimate the benefit: reduced turnover cost, reduced rework, faster time-to-revenue. Be conservative.
Then subtract the actual cost: vendor fees, internal time, facilitation, travel. The formula is straightforward: (benefits minus costs) divided by costs.
A conservative ROI number you can defend is worth more than an optimistic one that gets picked apart.
Step 7: Tell a story, not just a report
Charts don't move people by themselves.
A chart that shows a 23% reduction in regretted attrition in the pilot cohort, paired with an account of what actually changed in how those teams were managed and what people said in the open-text responses, is a different thing entirely. The data earns the credibility; the story makes it land.
Challenges and Limitations
This work is genuinely hard to do well, and the difficulties are specific enough that generic reassurances don't help. Here's what you're actually dealing with.
Attribution is messy
Many things change simultaneously. A team's performance improved, but so did their tooling, they got a new PM, and the product matured.
You can't run a controlled experiment the way a clinical trial does. The best tools available are staggered rollouts across comparable teams and matched-group comparisons.
Neither is perfect. What they do is make the attribution argument stronger, which is usually enough for internal decisions if not for academic publication.
Small sample sizes distort everything
Nick LeRoy, Owner of PPCJobs.com, runs a hiring platform focused on PPC and digital marketing talent.
He says, "One of the biggest mistakes organizations make is treating a single survey result or short-term trend as a definitive answer.
Talent decisions rarely happen because of one data point. The most useful signals come from watching patterns develop over time and combining quantitative metrics with what employees are actually saying."
At the team level, which is often where the most important cultural work happens, you're working with eight to fifteen people. A single outlier, one really unhappy engineer, one unusually excellent manager, moves the averages significantly.
Use trend lines rather than single data points, and use confidence ranges in your reporting. Don't claim a 4.2-point improvement in psychological safety; say scores increased meaningfully across the measurement period, with variance consistent with the sample size.
Time lags create pressure to give up
Retention and revenue take time to move, sometimes twelve to eighteen months from the intervention to the observable outcome.
This is where leading indicators earn their place. They're not just proxies, they're evidence that something is moving early, before the lagging metrics catch up.
Without them, you're flying blind for over a year, and that's when culture programs get cut because leadership can't see progress.
Toxic culture as a risk variable
MIT Sloan research identified toxic culture as a significantly stronger predictor of attrition than compensation.
This matters because it changes the priority order. If there's a team with real toxicity, that problem needs to be treated as a business risk with urgency, not as a culture initiative on a twelve-month roadmap.
Regular psychological safety checks and open-text sentiment monitoring are how you find these situations before they become departures, legal exposure, or public problems.
Cultural nuance
What reads as high psychological safety in a product team in a flat-hierarchy company might look entirely different in a manufacturing context or a highly regulated financial services firm.
The metrics travel; the benchmarks and interventions don't. Localize your interpretation, and be cautious about using cross-industry benchmarks as your primary reference.
Your own baseline over time is more useful than a comparison to an average that might not represent your context.
The Future of ROI in Team-Building and Culture Investments
The measurement frontier is moving in three directions:
- Causal inference over correlation: The difference between knowing psychological safety and retention move together versus knowing one actually drives the other. As this reaches standard HR platforms, attribution arguments get significantly stronger.
- AI on open-text feedback: Catches what numerical scores miss, language shifts around specific managers, early signals in how people describe their relationships, and what teams are quietly worried about. A layer on top of structured measurement, not a replacement.
- Maturing reporting standards: ISO 30414 is pushing consistent disclosure on turnover, internal mobility, and leadership development. Culture ROI conversations will increasingly have external benchmarks to reference, not just internal trends.
🎯 Making Culture Measurable
The organizations doing this best are the ones where people analytics, HR business partners, and operational leaders look at the same data together, regularly, with a shared habit of asking what it means and what to do about it.
Ready to start building the kind of culture worth measuring?
Confetti offers hundreds of live-hosted team building, DEI, and professional development experiences for virtual, hybrid, and in-person teams, trusted by over 25,000 organizations.